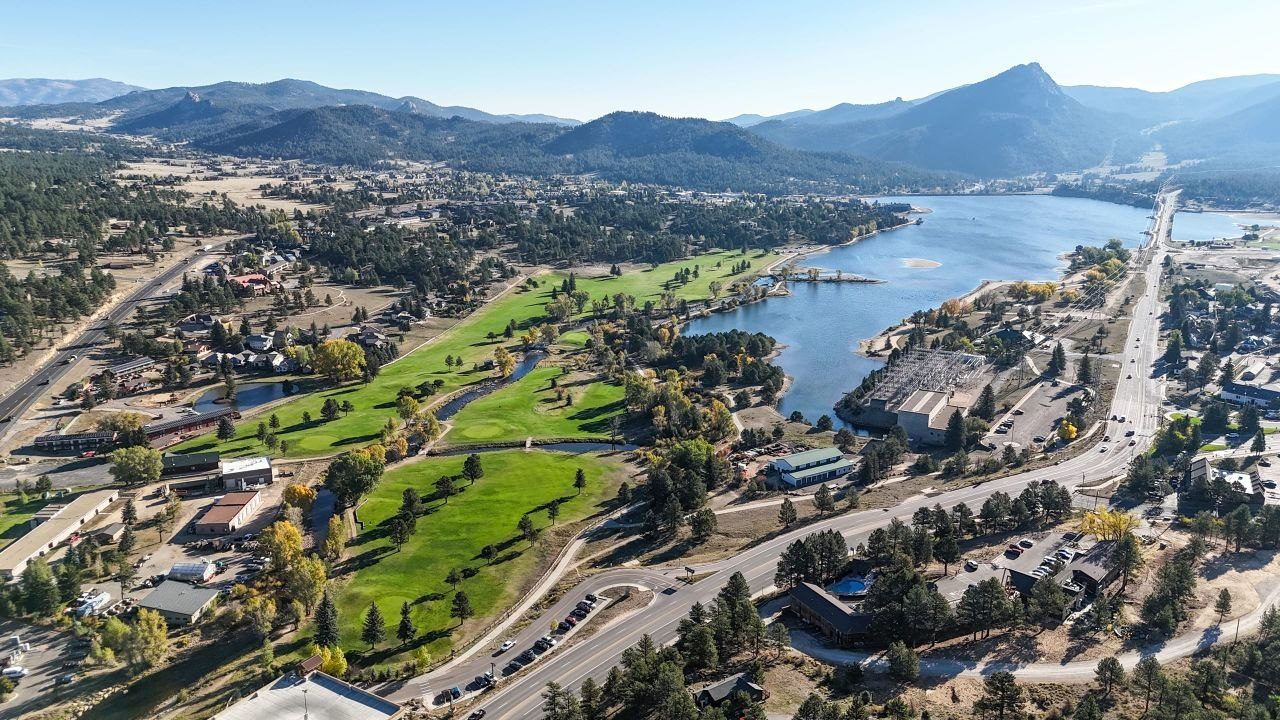
Aerial view of Estes Park with Lake Estes and the surrounding peaks
Gerald Mayo

Gerald Mayo · Estes Valley Real Estate

The Mayo Report

Estes Park & the Estes Valley

The most deeply measured small market in America

Market Balance

A descriptive blend of the two inputs below — not an index.

BuyerSeller

Strong buyer's market

8.5 months of inventory · 0.20 under contract per active

Region rollup

287 active
18,729 records in series
Median list$328,889
Median $/sqft$220
Median DOM163 days
Active / Closed287 / 10662
Close / list94.5%
Sold over list8.7%
Sold under list68.4%
Had a price cut28.2%
Median cut6.1%
Listing success56.3%
DOM p25 / p50 / p7546 / 91 / 196
Months of inventory8.2
Back on market4,019

Data courtesy of IRES as distributed by MLS Grid as of Sep 9, 2026, 5:13 PM MDT

Estes Valley Observations — Wednesday, August 19, 2026

The Mayo Report

Edition: Aug 19, 2026

A newer edition is overdue — this note last covered Aug 19, 2026.

Closings in the Estes Valley are running behind last year: 3 homes over the past seven days, against 7 in the same week a year ago. On Wednesday, August 19, 2026 itself, 1 home closed and 1 listing came on. 277 listings are active.

Counts from daily aggregates. No cause is inferred, and no individual listing is described. Figures as reported August 20, 2026.

Past editions →

Data courtesy of IRES as distributed by MLS Grid as of Sep 9, 2026, 5:13 PM MDT

Get the weekly Observations

Get the weekly Observations by email. One short note a week about the Estes Valley market. Unsubscribe any time.

Where the value sits

80510805158051780532
$189K → $368Kinsufficient data80511: no Census boundary published (PO-box ZIP) — see its panel below

Rocky Mountain National Park and Lake Estes outlines are decorative, for orientation only: US Census Bureau TIGERweb (public domain).

Data courtesy of IRES as distributed by MLS Grid as of Sep 9, 2026, 5:13 PM MDT

Year over year

This year Prior yearMedian sold price · $493K–$798K

Data courtesy of IRES as distributed by MLS Grid as of Sep 9, 2026, 5:13 PM MDT

Seasonality

Peak: June · $340,000. Median sold price by calendar month, pooled across every year held. Bars are relative, not zero-based — this compares months to each other, not to zero.

Data courtesy of IRES as distributed by MLS Grid as of Sep 9, 2026, 5:13 PM MDT

Active inventory mix

By price band, then by property type.

Under $300K
56 · 19.5%
$300K–$500K
56 · 19.5%
$500K–$750K
72 · 25.1%
$750K–$1M
44 · 15.3%
$1M–$1.5M
27 · 9.4%
$1.5M+
32 · 11.1%
Single Family Residence
102 · 35.5%
Condominium
46 · 16%
Unspecified
43 · 15%
Cabin
39 · 13.6%
Unimproved Land
20 · 7%
Mixed Use
10 · 3.5%

Data courtesy of IRES as distributed by MLS Grid as of Sep 9, 2026, 5:13 PM MDT

Supply and demand by price band

Region-wide · residential only

Bar is months of inventory — how long the band's active listings would last at the past year's pace of closings. The vertical line marks six months, the conventional balance point: longer favours buyers, shorter favours sellers.

Under $300K12.5 mo
Active25
Closed 12mo24
Median DOM113
Under contract16.0%
Sold over list0.0%
$300K–$500K7.2 mo
Active51
Closed 12mo85
Median DOM76
Under contract17.6%
Sold over list2.4%
$500K–$750K6.8 mo
Active69
Closed 12mo122
Median DOM72
Under contract31.9%
Sold over list6.6%
$750K–$1M6.9 mo
Active38
Closed 12mo66
Median DOM65
Under contract26.3%
Sold over list13.6%
$1M–$1.5M5.0 mo
Active22
Closed 12mo53
Median DOM54
Under contract22.7%
Sold over list1.9%
$1.5M+18.8 mo
Active25
Closed 12mo16
Median DOM68
Under contract0.0%
Sold over list6.3%

Bands are set on each listing's own price — what a closing sold for, what an active listing asks. Residential property only: land and commercial are excluded, since a building lot in the lowest band would move it away from anything a homebuyer would recognise. Published region-wide only — per-ZIP price bands leave too few listings in most cells to report.

Data courtesy of IRES as distributed by MLS Grid as of Sep 9, 2026, 5:13 PM MDT

Estes Park among mountain-resort markets

Source: Zillow ZHVI via Lotvox national database

An editorial peer set of US mountain-resort markets — towns whose housing market is dominated by a destination resort economy, chosen by hand across nine states. It is not derived from the data: this database holds no elevation or resort attribute, and a behavioural definition was tested and rejected.

Price level14th of 17$697,128 typical home value
Appreciation since 201614th of 17+82% over ten years

Estes Park is the value end of this group — about 42% below the cohort's median home value, with 3 of 16 peers cheaper still. Buying into a famous mountain market here costs a fraction of what it costs in the names above it.

Aspen, CO$3.47M
Park City, UT$2.2M
Telluride, CO$2.18M
Jackson, WY$1.96M
Vail, CO$1.89M
Ketchum, ID$1.56M
Incline Village, NV$1.49M
Avon, CO$1.26M
Breckenridge, CO$1.2M
Stowe, VT$1.05M
Frisco, CO$978K
Whitefish, MT$888K
Keystone, CO$835K
Estes Park, CO$697K
South Lake Tahoe, CA$676K
Taos, NM$445K
Lake Placid, NY$422K

Typical home value is the Zillow Home Value Index for each ZIP, as of 2026-06-30. Appreciation is measured over the ten years from 2016-06-30 — the longest window every market in this group shares, since the index begins at different dates in different places. Ranked among the 17 markets listed above and no others.

By ZIP code

80510

Allenspark · Boulder County

24 active
1,027 records in series
Median list$310,000
Median $/sqft$258
Median DOM176 days
Active / Closed24 / 540
Close / list96.0%
Sold over list6.7%
Sold under list74.4%
Had a price cut29.9%
Median cut8.9%
Listing success54.0%
DOM p25 / p50 / p7553 / 106 / 217
Months of inventory15.2
Back on market248

Too few reportable months to chart a trend — 5 of 24 months clear the 3-sale minimum.

Explore 80510 on Lotvox →

Data courtesy of IRES as distributed by MLS Grid as of Sep 9, 2026, 5:13 PM MDT

80511

Dacono · Larimer County

0 active
2 records in series

Not enough records to report (2 of 3 minimum). Metrics are withheld rather than estimated.

Back on market0

Too few closings here to report sale-price behaviour. Counts are shown; ratios are withheld.

Too few reportable months to chart a trend — 0 of 2 months clear the 3-sale minimum.

Data courtesy of IRES as distributed by MLS Grid as of Sep 9, 2026, 5:13 PM MDT

80515

Drake · Larimer County

43 active
2,056 records in series
Median list$189,000
Median $/sqft$193
Median DOM164 days
Active / Closed43 / 1149
Close / list96.5%
Sold over list8.9%
Sold under list70.5%
Had a price cut32.1%
Median cut7.5%
Listing success57.2%
DOM p25 / p50 / p7551 / 96 / 201
Months of inventory13.6
Back on market543
Median sold price · Oct 2024 – Sep 2026 · latest $385,000 · gaps = months with under 3 sales
Explore 80515 on Lotvox →

Data courtesy of IRES as distributed by MLS Grid as of Sep 9, 2026, 5:13 PM MDT

80517

Estes Park · Larimer County

202 active
14,924 records in series
Median list$367,500
Median $/sqft$229
Median DOM168 days
Active / Closed202 / 8594
Close / list97.6%
Sold over list9.2%
Sold under list70.0%
Had a price cut28.5%
Median cut6.0%
Listing success58.6%
DOM p25 / p50 / p7545 / 89 / 194
Months of inventory7.3
Back on market3,063
Median sold price · Oct 2024 – Sep 2026 · latest $874,000
Explore 80517 on Lotvox →

Data courtesy of IRES as distributed by MLS Grid as of Sep 9, 2026, 5:13 PM MDT

80532

Glen Haven · Larimer County

18 active
720 records in series
Median list$259,350
Median $/sqft$220
Median DOM173 days
Active / Closed18 / 378
Close / list96.2%
Sold over list7.4%
Sold under list74.3%
Had a price cut30.9%
Median cut7.6%
Listing success54.1%
DOM p25 / p50 / p7550 / 97 / 181
Months of inventory12.7
Back on market165

Too few reportable months to chart a trend — 4 of 24 months clear the 3-sale minimum.

Explore 80532 on Lotvox →

Data courtesy of IRES as distributed by MLS Grid as of Sep 9, 2026, 5:13 PM MDT

County records

Larimer County parcels

Source: Larimer County records via Lotvox

4 of 5 region ZIPs; Allenspark (80510) is Boulder County and is not in the Larimer record.

Owned from out of state25.0%2,383 of 9,539 parcels
Owner mails elsewhere49.6%4,782 of 9,632 parcels
Held in a trust16.0%1,545 parcels · estate planning
Held by an LLC or company15.3%1,473 parcels

Trust-held and company-held are reported separately and are not added together — a family trust is estate planning, not investment.

Where out-of-state owners live

TX 595NE 258KS 175CA 131FL 120MO 117IL 103IA 85

2.5% of parcels changed hands in 2025 (246 recorded sales against 9,632 parcels).

Median recorded sale price by quarter, 2020 Q1–2026 Q1; bars are quarterly sale counts. $412,690 in 2020 Q1rising 81% to a $745,000 high in 2022 Q4, and $650,000 in 2025 Q3. Dashed quarters are provisional and excluded from the high: county recording lags, so the newest quarters are incomplete.
County-deed repeat-sales price index · 1992=100+971.0%
1002004008002006 peak2010 trough1992200020052010201520202025

Log scale: equal vertical distance is equal percentage change. Values peaked in 2006, fell 8.0% to a 2010 low, then rose 150% through 2025. 2025 was down 2.4% on the year. 2026 is dashed and provisional — the county is still recording it.

Bailey-Muth-Nourse repeat-sales regression, unweighted. Each observation is one parcel sold twice, so composition cannot move the index — unlike a median sale price. 9,396 of 10,024 resale pairs used; 628 excluded (annualised move outside -30%..+40% excluded as non-market transfer or data error). Series begins 1992: Larimer recording coverage steps up sharply that year (Estes priced deeds 1991=176, 1992=593), so earlier years are not comparable. Repeat-sales indices do not adjust for renovation, so improvement between two sales is counted as appreciation.

How long owners stay · years since purchase

51% of Estes Valley owners are still here ten years after they buy.

0%25%50%75%100%median 10.3 yrs051015202530
Quarter of owners move on by 4.4 yrsHalf by 10.3 yrsThree quarters by 23.8 yrs

Kaplan-Meier. Holds still running are right-censored at today rather than dropped, so an owner who has held 20 years and has not sold still counts. 7,591 of 18,357 holds (41.4%) are still running and are counted this way. Counting only holds that have already ended would put the median at 5.6 years instead of 10.3 — the holds still in progress are disproportionately the long ones. Deeds from 1992 onward; a hold is measured between recorded sales, so an unpriced transfer into a family trust does not end one.

Source: Larimer County records via Lotvox. Assessor and recorder data; counts are of parcels, not households. Recording lags mean recent quarters are incomplete.